CamPermanent Manual
Part 2: Application Window
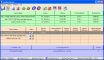
Application Window
ButtonBar Buttons
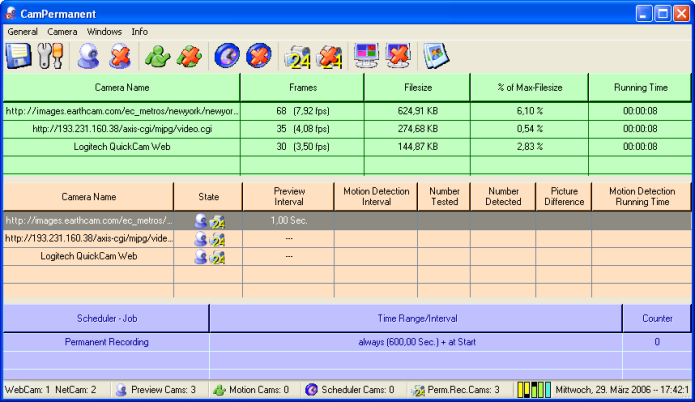
Permanent Recording-Listview Columns
Camera Name |
the camera name
- for WebCams this is the name which comes from the device driver
- for NetCams this is the camera picture URL
( the Camera Name could be changed into a user defined name ) |
Frames |
written frames since start of the recording |
Filesize |
filesize of the already recorded video ( m24 )
in kilobytes ( KB ) |
% of Max-Filesize |
the percentage of the already recorded video filesize
in reference to the adjusted maximal filesize |
Running Time |
the permanent recording running time, ( d hh:mm:ss
) |
Camera-Motion-Detector Listview Columns

Camera Name |
the camera name
- for WebCams this is the name which comes from the device driver
- for NetCams this is the camera picture URL
( the Camera Name could be changed into a user defined name ) |
State |
the state is shown by small icons:
 preview
is active preview
is active
 the
motion detector is running the
motion detector is running
 the
permanent recording is running the
permanent recording is running
 the
scheduler is running the
scheduler is running
 the
video recording is active the
video recording is active
 the
FTP client is running the
FTP client is running
 the
Email client is running the
Email client is running
 the
camera is sending the camera picture to a remote video
client the
camera is sending the camera picture to a remote video
client
|
Preview Intervall |
the picture receiving interval ( for
all direct connected video devices with a live video stream there
is shown '---' ) |
Motion Detection Intervall |
the motion detecting interval |
Number Tested |
how often the program has tested for motion since
motion detection start |
Number Detected |
how often the program has detected a motion since
motion detection start |
Picture Difference |
the last picture difference |
Motion Detection Running Time |
the motion detection running time, ( d hh:mm:ss
) |
Scheduler-Listview Columns
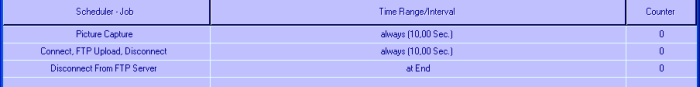
Scheduler - Job |
the function which should be executed |
Time Range/Interval |
the point in time, time interval, time range at
which the function is executed |
Counter |
how often the function was executed |
The scheduler listview shows the settings
from the selected camera!
Status Bar
The status bar shows the available cameras and the mode in
which they are running, the current time/date and the network activity.
Network Activity 
The columns shows the activity of the video network server/client and
the webserver.
The yellow columns shows the activity of the network server, the green
columns of the network client and the blue-green column of the webserver.
Down running black dots signals incoming datas, up running dots signals outgoing
datas.
Part
3 >> |